29 Jun 2026
Charting the Networks of Interaction in Web-Based Multiplayer Tournament Environments
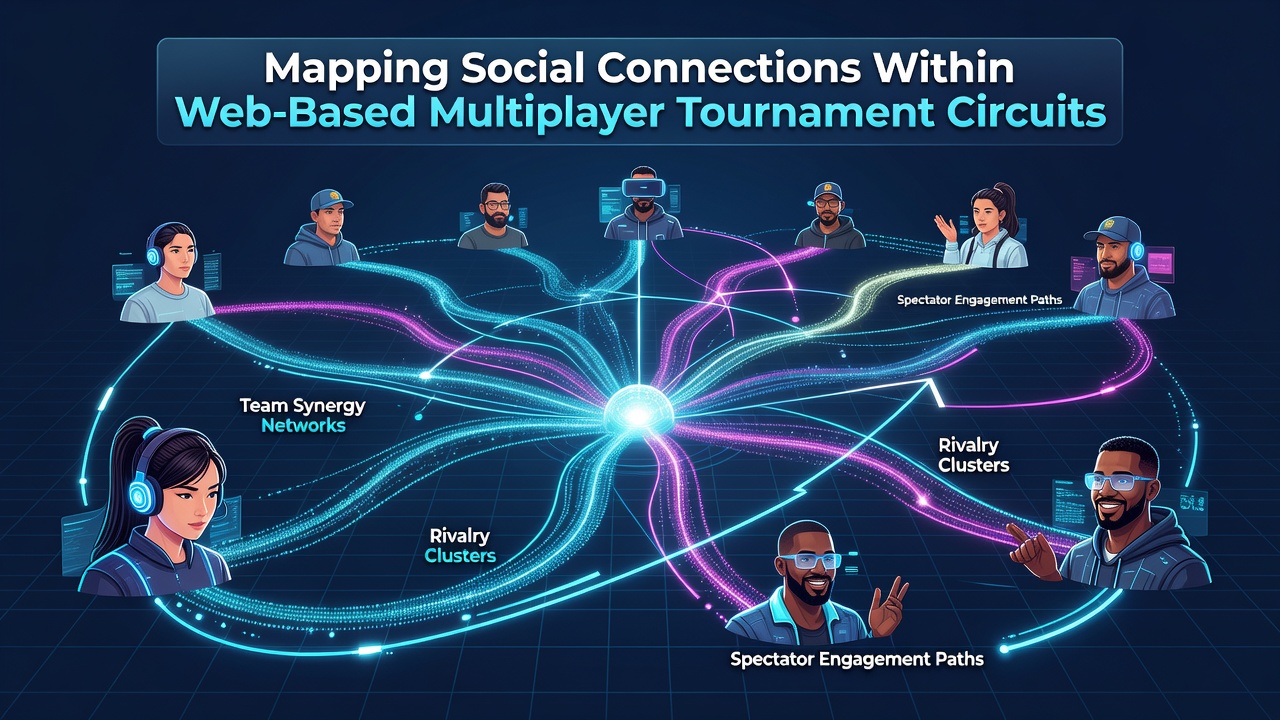
Web-based multiplayer tournament circuits operate through structured competition formats where participants engage across distributed servers and platforms, creating measurable patterns of interaction that extend beyond individual matches. These systems rely on registration databases, match histories, and communication logs to track how players form alliances, rivalries, and recurring groups over time. Data from such circuits reveal clusters of activity that researchers analyze using graph theory to identify central figures and peripheral participants within larger communities.
Platform operators collect timestamps, team compositions, and chat records to build adjacency matrices that represent direct connections between users. In practice, this means a single tournament bracket can generate thousands of edges when repeated pairings occur across weekly events. Observers note that certain circuits maintain public leaderboards which further reinforce visibility of high-degree nodes, those players who compete against or alongside many others throughout a season.
Data Collection Methods Across Platforms
Developers implement APIs that export anonymized participation metrics while preserving relational information such as shared team memberships and mutual opponents. Academic teams then apply community detection algorithms like Louvain or Girvan-Newman to partition these graphs into subgroups that correspond to regional leagues or skill-based divisions. Figures released in mid-2025 indicated that average cluster sizes in major circuits ranged between 12 and 47 participants, depending on game genre and entry requirements.
June 2026 brought additional datasets when several North American tournament hosts updated their logging standards to include voice-channel metadata alongside text interactions. This expansion allowed analysts to measure tie strength more precisely by combining frequency of co-participation with duration of concurrent communication sessions. European research groups subsequently cross-referenced these records with server latency patterns to distinguish between local and cross-continental connections.
Structural Patterns Observed in Tournament Graphs
Centrality measures applied to tournament data consistently highlight a small number of players who occupy brokerage positions between otherwise separate clusters. These individuals often participate in multiple divisions simultaneously, creating bridges that facilitate information flow about strategies and upcoming events. Peripheral players, by contrast, tend to remain within single clusters and exhibit lower betweenness scores, reflecting more localized engagement patterns.
Longitudinal tracking shows that edge persistence varies significantly, with some connections dissolving after one event while others recur across months or years. Researchers at institutions in Canada and Australia have documented how seasonal resets in ranking systems temporarily disrupt dense subgraphs before new ties reform around updated skill tiers. Such resets provide natural experiments for studying network resilience under changing conditions.
Regional Variations in Connection Density
Comparative studies indicate differences in average degree across geographic regions. Circuits hosted primarily in East Asian time zones demonstrate higher daily interaction rates, while those serving broader global audiences show more fragmented but wider-reaching networks. A 2025 report prepared by the Interactive Games Association of Australia examined several browser-based circuits and found that Oceania-based participants maintained fewer but more stable ties compared with North American counterparts who rotated through larger pools of opponents.
Platform design choices influence these outcomes directly. Tournaments that incorporate persistent group features encourage repeated pairings, whereas single-elimination formats without carry-over mechanics produce sparser graphs overall. Data released through academic repositories demonstrate that hybrid models combining both approaches generate intermediate density levels that support both transient competition and longer-term subgroup formation.
Analytical Tools and Visualization Techniques
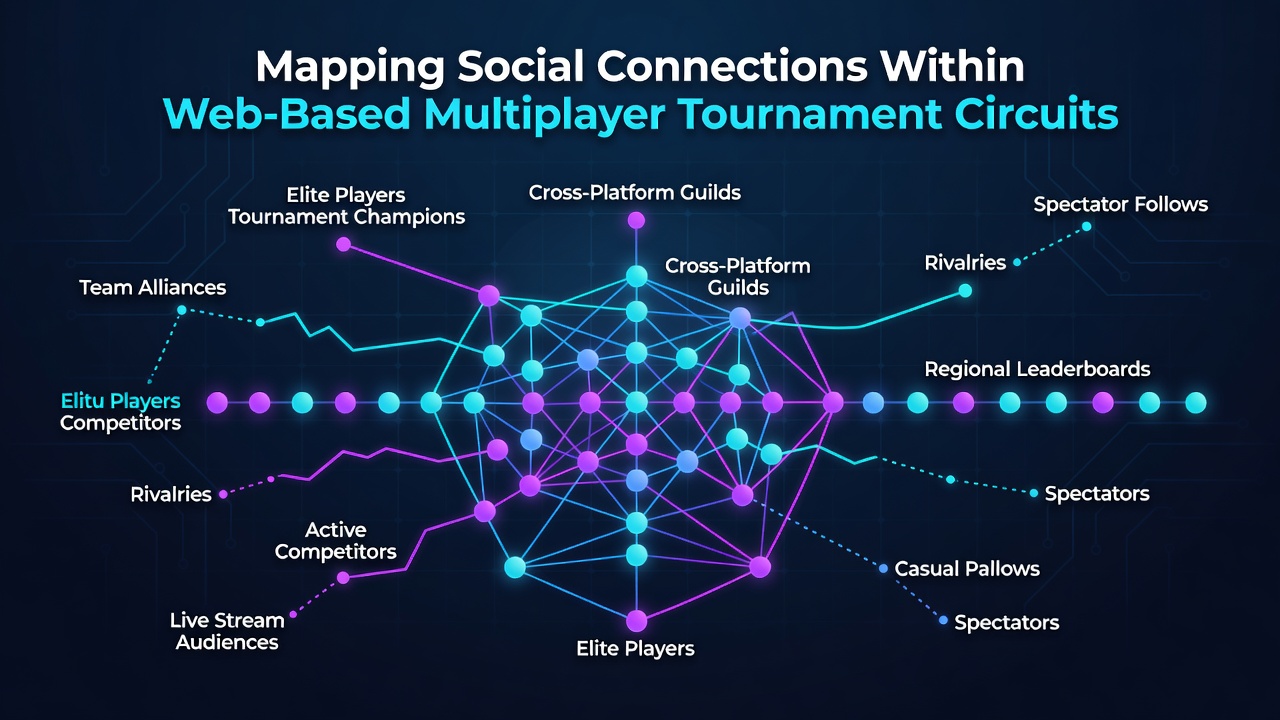
Network visualization software such as Gephi and Cytoscape processes exported tournament logs into force-directed layouts that position highly connected players near the center of rendered diagrams. Analysts overlay temporal filters to observe how clusters evolve between preliminary rounds and championship stages. These renderings help identify emerging subgroups before they appear in official rankings or community forums.
Statistical packages calculate modularity scores that quantify the strength of division between detected communities. Higher modularity values suggest clear separation between regional or skill-based segments, whereas lower scores point to more integrated circuits where cross-group interaction occurs frequently. University-affiliated teams continue to refine these metrics by incorporating additional variables such as win-rate correlations and shared achievement unlocks.
Conclusion
Mapping social connections within web-based multiplayer tournament circuits relies on systematic collection of participation and communication data followed by graph-analytic techniques that reveal underlying structures. Continued updates to logging standards and cross-regional collaboration among researchers support increasingly detailed examinations of how these networks form, persist, and adapt across different formats and populations.